How to Make D-band Noise Figure Measurement ?

In the early 6G research, new sub-THz frequency bands have been explored especially the D-band (110- 170 GHz) for early research prototyping and system performance validation. For those early prototype systems, Noise Figure as one fundamental RF parameter would always be required to measure and characterize the performance of the whole system. Noise Figure is essential to verify new designs and demonstrate the device under test (DUT) meets specifications.
A new Noise Figure measurement solution in D-band is introduced consisting of KEYSIGHT X-Series signal analyzer with N9069EM0E Noise Figure Measurement Application, VDI system downconverter and Noise Source, and Keysight Microwave Signal Generator as Local Oscillator (LO).
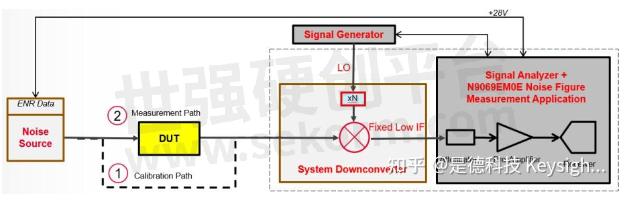
Figure 1. Noise figure measurement solution in D-band
In the above D-band Noise Figure Measurement Solution, the DUT works in D-band with a frequency range from 110 GHz to 170 GHz. The Noise Source is used to provide broadband noise into the DUT input with pre-calibrated Excess Noise Ratio (ENR) values. The System Downconverter is used to convert the input D-band frequency from the DUT output to a fixed IF frequency. The Signal Analyzer with N9069EM0E Noise Figure Measurement Application uses the Y-factor method to calculate the noise figure of the DUT.
The noise figure measurement system shown in Figure 1 can be seen as a two-stage system as illustrated in Figure 2. 'Stage 1' is DUT, and 'Stage 2' is Equivalent NF Instrument, that is, the system downconverter plus the signal analyzer shown in Figure 1
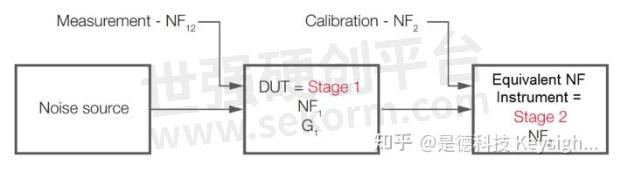
Figure 2. Noise figure measurement uses a two-stage system
The DUT noise figure can be calculated using the following equations:
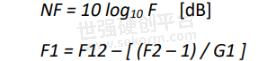
Thus,
![]()
Where,
• NF1 is the DUT noise figure to be measured.
• NF2 is the equivalent NF instrument noise figure, measured through the calibration path.
• NF12 is the system noise figure, including both the DUT and the equivalent NF instrument, measured through the measurement path.
• F1 is the noise factor of the DUT.
• F2 is the noise factor of the equivalent NF instrument.
• F12 is the system noise factor.
• G1 is the gain of DUT
How to Choose the Appropriate IF Frequency
The noise source generates broadband noise. For the system downconverter, the noise input includes both the upper and the lower sideband (USB and LSB) frequency bands, which will be converted to the same intermediate frequency (IF), as indicated in Figure 3a. In a single sideband (SSB) measurement, the noise power in the unwanted sideband is suppressed by appropriate “image rejection” filtering at the input of the mixer. In a double sideband (DSB) measurement, the NF measurement will display an average of the USB and LSB responses.
In a DSB system downconverter setup (in this case, N9029AV06-DC9), noise input from both the USB and LSB will be converted to the same IF. The DSB system downconverter measurement has implicit linear averaging of the DUT characteristics. The same ENR values are used for both the USB and LSB frequencies and are taken from the average frequencies of the USB and the LSB. This corresponds to the LO frequency. The results returned are the average of the two sideband powers.
The benefits of DSB measurements are minimal filter requirements because they don’t require image rejection filter design and matching. In DSB measurements, the IF frequency is usually selected as low as possible, to minimize the separation between the sidebands, and thus to minimize the effect of the frequency differences and to get the optimum resolution possible, as indicated in Figure 3b.
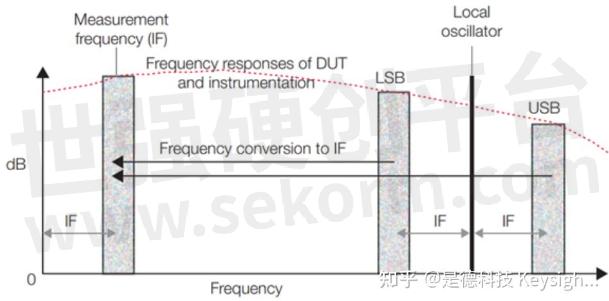
Figure 3a. A double sideband measurement responds to noise in both sidebands (USB and LSB). Results may be affected by variations in DUT, noise source, and instrument performance with frequency.
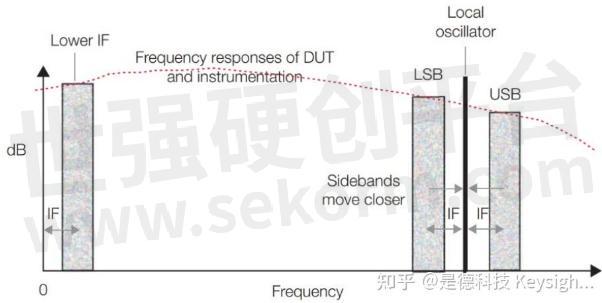
Figure 3b. Reducing the IF for a DSB measurement can also reduce the effect of differences in noise figure (and/or ENR of noise source) between the LSB and USB. Compare against Figure 3a.
In practice, it’s also required to configure the noise figure of equivalent NF instrument (in this case, N9029AV06-DC9 + signal analyzer) as low as possible, to improve the overall measurement accuracy by reducing the contribution from the measurement instrumentation.
Another consideration is that if the instrument NF is 10 dB larger than the ENR value of the noise source, the calibration will not work well. For N9029AV06-NSM, the ENR is about 10 dB. The noise figure of the equivalent NF instrument needs to be kept lower than 20 dB. As shown in Figure 4, the noise figure of the equivalent NF instrument (in this case, N9029AV06-DC9 + signal analyzer) is acceptable when IF is 50 MHz or higher. As shown in Figure 5, the calibration is acceptable when IF is 150 MHz.
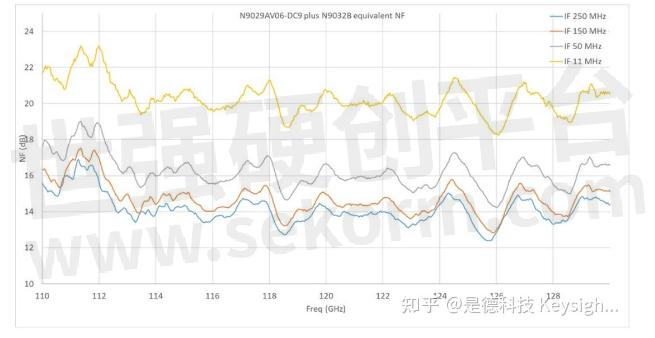
Figure 4. Noise figure of equivalent NF instrument with different IF frequency
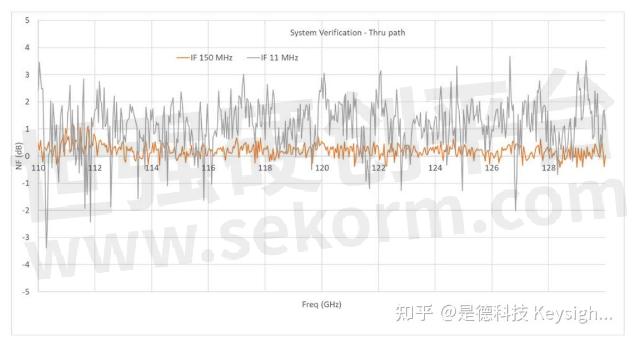
Figure 5. Noise figure measurement uses a two-stage system
To balance the impacts from the DSB measurement and the noise figure of the equivalent NF instrument, it's recommended to use a fixed IF frequency between 50 and 150 MHz.
Considering the LO Leakage
If the spectrum of the IF output is viewed in Swept SA measurement, there will be an “Input Overload” warning (Figure 6a) with the same hardware setting as in Noise Figure measurement. When LO input power is 5 dBm, the leakage to IF Output is about -11 dBm at the higher frequency when the signal generator sweeps (Figure 6b).
However, in NF measurement, this is usually not a concern because the IF frequency used is between 50 and 150 MHz, and the leakage frequency is much higher (in this case, 18.368 GHz), above 3.6 GHz, so the internal filter of the signal analyzer will filter out the LO leakage, which would not affect the NF measurement.
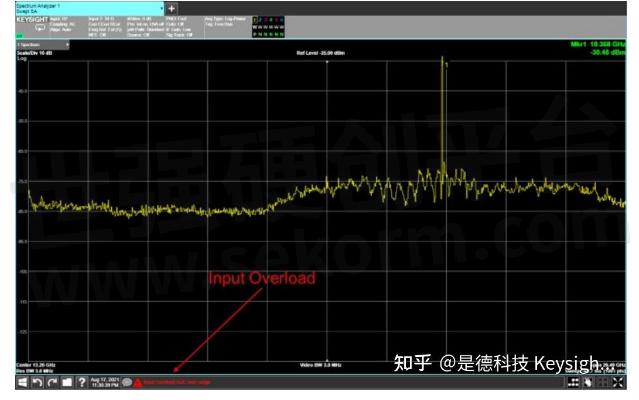
Figure 6a. Input Overload in Swept SA measurement with the same setting as NF measurement
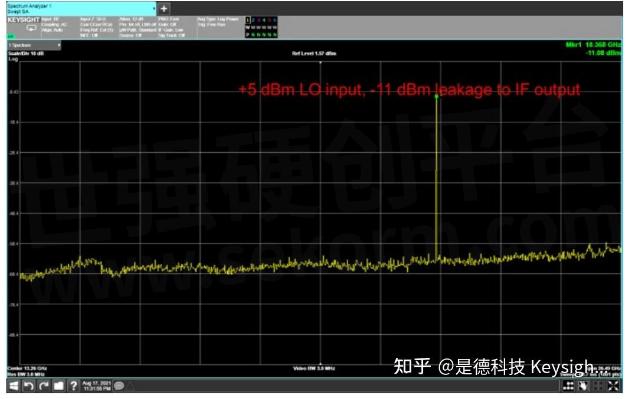
Figure 6b. LO leakage power to IF Output
Configuring Noise Figure Measurement System
A typical block diagram for D-band Noise Figure Measurement System is shown in Figure 7a, which includes:
• N90x0B: Keysight X-Series signal analyzer
• N9069EM0E: Noise Figure (NF) measurement application
• N5183B/E8257D (or similar): microwave analog signal generator (9 kHz -40 GHz)
• N9029AV06-DC9: VDI system downconverter with 9V DC supply (110-170 GHz) 1
• N9029AV06-NSM: VDI WR6.5 noise source module with isolator (110-170 GHz)
• Isolator: waveguide isolator 2
• N9029AV06-SW1/SW2: WR6.5 standard straight one-inch/two-inch waveguide section
• DUT: Low Noise Amplifier (LNA)
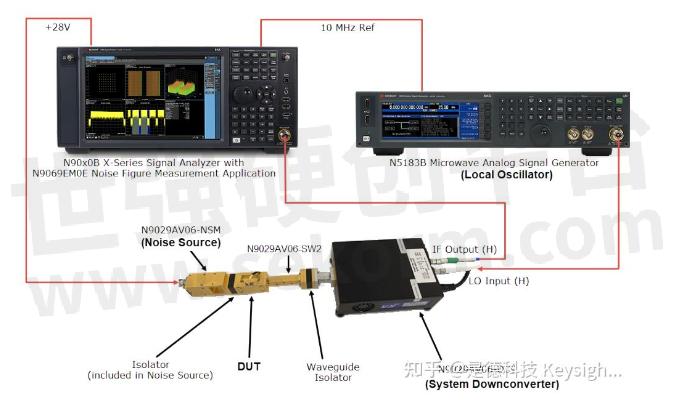
Figure 7a. Noise figure measurement setup
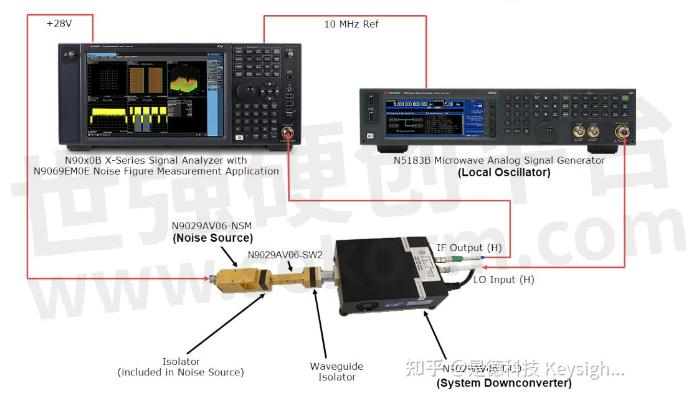
Figure 7b. Noise figure measurement calibration setup
Before configuring the measurement system, make sure the following connections are set up correctly:
• Connect the NOISE SOURCE DRIVE OUT +28 V (PULSED) port from the rear panel of the signal analyzer to the noise source +28VDC port.
• Connect the IF Output (H) port of the system downconverter to the RF Input of the signal analyzer. See Figure 8.
• Connect the RF Output of the signal generator to the LO Input (H) port of the system downconverter. See Figure 8.
• When doing Calibration, refer to Figure 7b to connect the noise source to the system downconverter.
• When doing Measurement, refer to Figure 7a to insert DUT between the noise source and system downconverter. Use the appropriate waveguide section as adapter and appropriate isolators to improve the match between DUT and the instrument
• Connect the 10 MHz OUT of the signal analyzer to the REF IN of the signal generator. This locks the signal generator and the analyzer together for better measurement accuracy.
• Plug in the power supply and USB, GPIB, or LAN connection as needed.
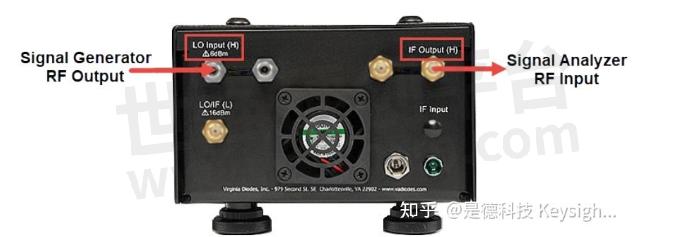
Figure 8. The rear view of N9029AV06-DC9. Please note that the connected ports should be LO Input (H) and IF Output (H).
Configuring system downconverter
In the Noise Figure measurement system, N9029AV06-DC9 is acting as the system downconverter, which is present in both the calibration (Figure 7b) setup and the measurement setup (Figure 7a). This section focuses on the setup for the system downconverter. More details on how to use the system downconverter in N9069EM0E Noise Figure Measurement Application can be found in Noise Figure Measurement Guide.
On the user interface of N9069EM0E, tap the controls, Meas Setup -> Settings -> DUT Setup & Calibration (Figure 9). Select the tab of Measurement and set system downconverter parameters as shown below:
Table.1
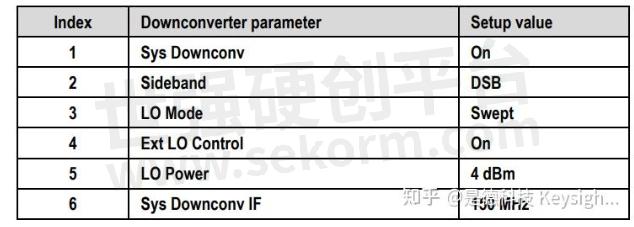
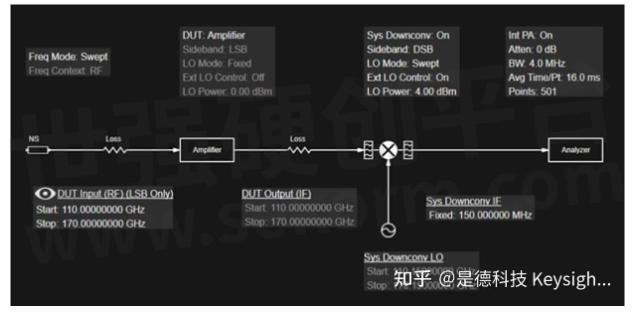
Figure 9. System downconverter parameter settingsConfiguring external LO control
In the noise figure measurement system, N5183B is acting as the system downconverter LO. This section focuses on the setup for the system downconverter LO. N9069EM0E application can control and sweep the system downconverter LO automatically.
Adding external LO to list
Before setting the system downconverter LO control, you first need to add the target LO to the external LO list.
On the user interface of N9069EM0E, tap the controls, Meas Setup -> Settings -> Ext LO Setup -> LO Select. In the LO Select dialog page, add the LO according to the method that your signal generator is connected to the signal analyzer. You can connect to the external LO through USB, GPIB, or LAN (Figure 10).
In this case, the system downconverter LO, N5183B, is using LAN connection.
Enter the IP Address of N5183B and tap Add Specified IP Address. The connected N5183B will appear in the Available Source List. Close the current dialog page and continue to set up the system downconverter LO
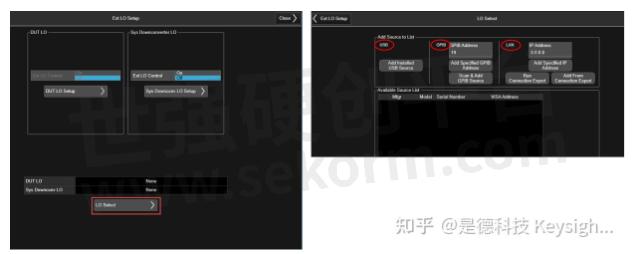
Figure 10. External LO control – LO SelectSetting up system downconverter LO
On the user interface of N9069EM0E, taps the controls, Meas Setup -> Settings -> Ext LO Setup -> Sys Downconv LO Setup. Set the system downconverter LO parameters as below:
Table.2
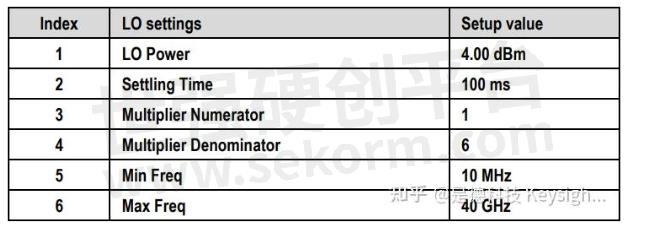
As shown in Figure 11, set “Multiplier Denominator” to 6 (according to Multiplication Factor N on the label of N9029AV06-DC9).

Figure 11. External LO control parameter settingsLoading ENR data for noise source
You can enter noise source ENR data in the form of an ENR table in the following ways:
1. Manually input the required frequencies and corresponding ENR values. On the user interface of N9069EM0E, tap the controls, Meas Setup -> Settings -> ENR -> Edit Meas Table, then add the ENR vs. Frequency values.
2. Load the ENR data from a USB storage device or hard drive on which the data has been previously stored. On the user interface of N9069EM0E, tap the controls, Recall -> ENR Table -> Meas (Common) Table > Recall From, select the ENR .csv file you need, and click Recall to upload the file.
If there are no more frequency conversions in the DUT, ENR data for the same frequency range is used for both calibration and measurement. More details on entering ENR data in N9069EM0E Noise Figure Measurement Application can be found in Noise Figure Measurement Guide.
Making Noise Figure Measurement
The complete Noise Figure measurement of DUT consists of two steps: Calibration and Measurement. In each step, the analyzer measures the noise power twice, corresponding to the noise source On and noise source Off while the system downconverter LO sweeps over the frequency range in D-band. The operation is automatically controlled and performed by N9069EM0E Noise Figure Measurement Application.
Calibrating equivalent NF instrument
Connect the noise source and the signal analyzer following the setup in Figure 7b. The noise source is connected directly to the input of the equivalent NF instrument.
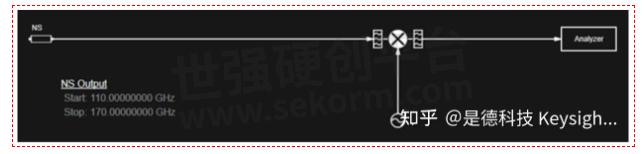
Figure 12. N9069EM0E calibration setup
Calibration is done without DUT in place to measure the noise figure contributed by the equivalent NF instrument. When corrected measurements are performed, the displayed results shows the DUT noise figure.
On the N9069EM0E user interface, tap the controls, Meas Setup -> Settings -> CALIBRATE.
When the calibration is completed and no DUT inserted, both gain and noise figure results are near 0 dB. This shows that the analyzer has removed the noise contribution from the measurement system.
Making noise figure measurement on DUT
Insert the DUT between the noise source and the signal analyzer following the measurement setup in Figure 7a and Restart the measurement. The measurement result appears on the analyzer’s display.
It’s recommended to use a Waveguide isolator between DUT output and the RF Input Port of N9029AV06-DC9 to improve impedance match and reduce possible standing waves.
Noise figure measurement Example 1
This example uses a VDI WR8.0AMP-LN low noise amplifier (LNA) as DUT, with a frequency range from 90 GHz to 140 GHz. The start frequency of DUT Input is set to 110 GHz and the stop frequency of DUT Input is set to 130 GHz so that the frequency range falls within the working range of the D-band NF measurement system.
Step 1. Calibration: See Calibrating equivalent NF instrument
Follow the calibration setup shown in Figure 7b and perform the calibration. After calibration, the expected noise figure and gain are both near 0 dB (Figure 13) since no DUT is connected yet. This is an easy way to verify if the NF measurement system is working properly.
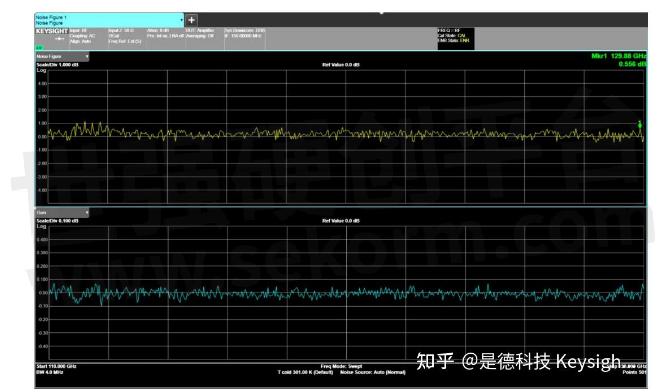
Figure 13. Equivalent NF instrument calibration verification from 110 GHz to 130 GHz
Step 2. Measurement:
Once the DUT is inserted between the noise source and the equivalent NF instrument, the noise figure and gain can be measured. The results show that the noise figure of the DUT is about 4 dB and the gain of the DUT is about 20 dB (Figure 14). The DUT (in this case, LNA) therefore meets its manufacturer’s specification over the frequency range of interest.
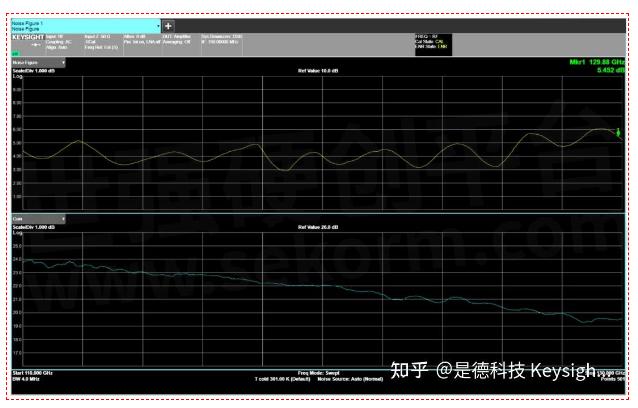
Figure 14. DUT (WR8.0AMP-LN) measurement results from 110 GHz to 130 GHzNoise figure measurement Example 2
This example uses a VDI WR5.1AMP-LN low noise amplifier (LNA) as DUT, with a frequency range from 140 GHz to 220 GHz. The start frequency of DUT Input is set to 140 GHz and the stop frequency of DUT Input is set to 170 GHz, so that the frequency range falls within the working range of the D-band NF measurement system.
Step 1. Calibration: See Calibrating equivalent NF instrument
Follow the calibration setup shown in Figure 7b and perform the calibration. Similar to Example 1, after calibration, the expected noise figure and gain are both near 0 dB (Figure 15) since no DUT is connected yet. This is an easy way to verify if the system is working properly.
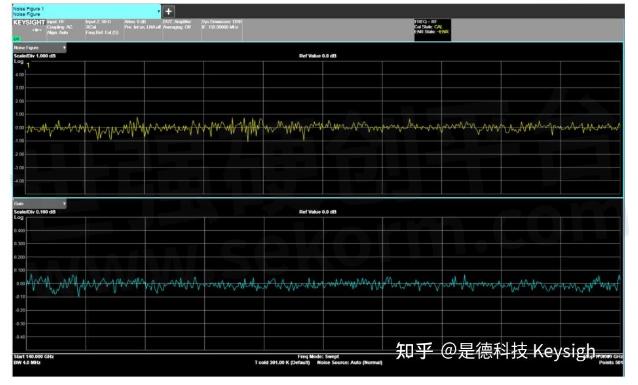
Figure 15. Equivalent NF instrument calibration verification from 140 GHz to 170 GHz
Step 2. Measurement:
Once DUT is inserted between the noise source and the equivalent NF instrument, the noise figure and gain can be measured. The results show that the noise figure of the DUT is about 6 dB and the gain of the DUT is about 21 dB.
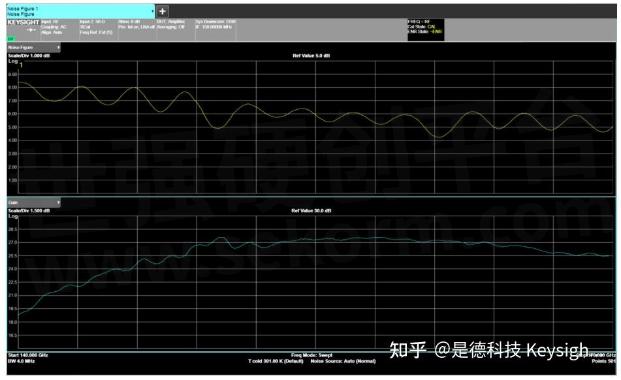
Figure 16. DUT (WR5.1AMP-LN) measurement results from 140 GHz to 170 GHz
Specifications and performance data for the DUT (WR5.1AMP-LN) are shown in Figure 17. The measured noise figure of 6 dB and gain 21 dB match the values in DUT’s datasheet.
Conclusion
The Keysight D-band Noise Figure measurement solution (as shown in Figure 3a) can perform high-accuracy D-band Noise Figure measurements, covering the full range of D-band frequency from 110 GHz to 170 GHz. The measurement system has an overall low noise figure for high system accuracy. Additional components, like filters and external low noise amplifiers (LNA), are not required for modest DUT noise figure measurement. The Keysight signal analyzer provides self-contained self-controlled measurements with a noise source and system downconverter by using N9069EM0E Noise Figure Measurement Application. The N9069EM0E Noise Figure Measurement Application is easy to use. The application performs D-band Noise Figure measurement with a simple two-step procedure: Calibration and Measurement. Once the calibration is done, you can make a one-button D-band Noise Figure measurement on your DUT and get both results of Noise Figure and Gain to quickly evaluate your DUT performance.
- |
- +1 赞 0
- 收藏
- 评论 0
本文由三年不鸣转载自Keysight Technologies ZhiHu,原文标题为:How to Make D-band Noise Figure Measurement ?,本站所有转载文章系出于传递更多信息之目的,且明确注明来源,不希望被转载的媒体或个人可与我们联系,我们将立即进行删除处理。
相关研发服务和供应服务
相关推荐

Keysight(是德科技)频谱分析仪和信号分析仪选型指南
目录- Spectrum Analyzer and Signal Analyzer Product Introduction Benchtop spectrum and signal analyzers Modular Signal Analyzer Handheld Signal Analyzer Applications and Measurement Software
型号- M9393A,8560E,M9391A,N934XC,8562E,N934XB,8562EC,8561EC,8560EC,N9936A,N9914A,N9342C,859XB,N9320B,8565EC,859XC,8564EC,N9340B,8563EC,859XA,N9322C,N9344C,N991XA-233,N9040B,U2020,N993XA,N9938A,N9916A,HP8568,N9918A,HP8566,8561E,8563E,N9935A,N9913A,8565E,N9343C,X-SERIES,N9030A,N9020A,N9010A,N9000A,N9937A,N9915A,89600,N9917A,M9290A

Keysight(是德科技)信号发生器选型指南(英文)
目录- Signal Generator Agile and Vector Signal Generators Analog Signal Generators Signal Studio Software PSG Signal Generators X-Series Signal Generators RF Analog Signal Generator Baseband Generator,Interface Module PXI Signal Generators Legacy Signal Generators
型号- 8657J,N5172B,E4425B,E4437B,8657D,8645A,8657B,8657A,ESG-D,8672A,N5173B,E4424B,E4436B,8644B,8656B,E4400B,E8257DSXX-SERIES,83620B,ESG-A,83620A,M9381A,8340B,8340A,N5106A,E4431B,8647A,N9310A,8648A,83712B,83712A,ESG-AP,E4430B,83752B,83752A,M9380A,83630L,N5191A,8662B,E8257D,8662A,E4438C,E4426B,E2500B,83711B,83711A,83630B,83751B,83751A,8665A,8665B,E4421B,E4433B,N5193A,83640L,N5181B,8341A,N5181A,8341B,E8663D,8664A,E4428C,E4420B,8648D,E4432B,8648B,E8267D,8648C,83624B,83624A,83640B,N5194A,8780A,N5182B,N5182A,83623L,E4435B,8643A,N5102A,E4423B,83732B,83623B,83732A,83650L,N5171B,N5183B,8763D,N5183A,8763B,8763C,E8257DVXX-SERIES,X-SERIES,8763A,E4422B,E4434B,83622B,83731A,ESG-DP,83622A,83650B,83731B

N9000B CXA X系列信号分析仪,多点触控配置指南
型号- N9000B-P13,N9000B-W10,N9000B-503,N9000B-526,N9000BU-ABE,N9000B-507,N9000BU-SF1,N9000B-SF2,N9000BU-SF2,N9000B-SF1,N9000B-PRC,N9000BU-ABJ,N9000BU-B25,N9000BU-ABF,N9000B-B25,N9000BU-SS1,N9000BU-SS2,N9000BU-P03,N9000BU-P26,N9000BU-FSA,N9000B-SS1,N9000BU-T06,N9000B-EDP,N9000B-P03,N9000BU-EMC,N9000BU-PFR,N9000B-FSA,N9000BU-ESC,N9000B-P26,N9000B-A6J,N9000B-P07,N9000B-T03,N9000BU-P07,N9000BU-T03,N9000B-513,X-SERIES,N9000B-T06,N9000B-AMG,N9000BU-CR3,N9000B-PFR,N90EMPSMB,N9000B,N9000B-UK6,N9000BU-AKT,N9000B-CR3,N9000BU-AB2,N9000B-EP4,N9000BU-P13

MXG X系列信号发生器N5183B微波模拟数据表
型号- N5183B-513,836XX SERIES,E8244A,8665A,8665B,SMJ100A,8648,N5183B-520,8648 SERIES,SMIQ,N5181A,N5161A,8341B,E8267C,E8247C,SMBV100A,E4428C,E443XB,8664A,E8251A,8656B,8644A,E8663B,E8267D,SML,SMR,SMATE200A,SMV,N5162A,N5183B-532,SMU200A,N5182A,8340B,E8254A,8663A,83732B,MXG X,83712B,SMB100A,83752B,N5183B-540,E442XB,N5183B,N5183A,SMF100A,E8257D,E8257C,8662A,X-SERIES,E4438C,E8241A,MXG X-SERIES,83711B,MG369XA,836XX,MG369XB,MG369XC,83751B,83731B
PXA X系列信号分析仪N9030A 3 Hz至3.6、8.4、13.6、26.5、43、44或50 GHz数据表
型号- N9030A-544,E2675A,N9030A-543,N9030A-550,N9030A-NF2,X-SERIES,N9030A-508,N9030A,N9030A-513,E2669A,N9030A-526,E2668B
E8257D PSG微波模拟信号发生器数据表
型号- E8257D-UNY,E8257D-1EU,E8257D-UK6,E8257D-UNX,E8257D-UNW,E8257D-UNU,E8257D-UNT,E8257D-AMG,E8257D-HCC,E8257D-550,E8257D-1ED,E8257D-C09,E8257D-1SM,E8257D-H1S,E8257D-1EM,E8257D-513,E8257D-532,E8257D-1EH,E8257D-A6J,E8257D-HY2,E8257D-ABA,E8257D-1E1,E8257D,E8257D-1A7,E8257D-540,E8257D-008,E8257D-567,E8257D-007,E8257D-521,E8257D-520
X系列信号分析仪N9020A MXA信号分析仪
描述- 本资料为Keysight X-Series Signal Analyzers的MXA信号分析仪规格指南,内容涵盖MXA信号分析仪的定义、要求、规格参数、选项和测量应用等。资料详细介绍了信号分析仪的频率、时间、带宽、幅度、动态范围、相位噪声、功率测量等关键性能指标,并对不同选项和应用的规格参数进行了详细说明。
型号- N9064A-2TP,N9064A-1TP,N9064A-3FP,N9064A-2FP,N9020A-EP2,N9064A-1FP,N9064A-3TP,N9020A
MXG X系列信号发生器N5183B微波模拟配置指南
描述- 本资料为MXG X-Series微波模拟信号发生器N5183B的配置指南,详细介绍了如何根据需求选择频率范围、连接器配置、性能增强选项、软件应用、附件和售后服务等。指南还包括了如何升级现有MXG信号发生器的信息,以及相关文献和联系方式。
型号- N5183B-1ED,E8257D-V08,N5183BU-UW2,E8257D-V06,E8257D-V05,PS-X10,N5172B,N5183B-513,N5183B-1EM,N5183B-AMG,N5183A-1ED,N5183B-1ER,N5183A-HNS,N5183A-1EA,N5183A-540,E8257D-V03,E8257D-V02,E8257D-V01,N5183B-UZ2,N5183A-1E1,N5183BU-006,N5183A-UNZ,N5183B-520,N5181B,N5183B-006,E8257D-V15,N5183BU-UZ2,N5173B,E8257D-V1B,PS-T10-ASG,PS-S20,N5183B-CVR,N5183A-532,1CM110A,N5183BU-1ER,N5183A-UNT,N5183B-UNC,E8257D-V12,E8257D-V10,N5183A-UNW,N5183B-UW2,R-50C-011-10,PS-S10,N5183B-532,N5183B-A6J,N5182B,N5180320B,N5183BU-1EA,N5183B-UNT,E8257D-V2B,N5183B-UNW,1CN106A,N5183BU-0BW,1CR112A,N5183A-520,N5183B-UNY,N5183B-UK6,N5183B-UNZ,N5173BU-1E1,N5183BU-AXT,N5183A-006,N5183BU-303,N5183B-CD1,N5183B-540,N5183BU-CD1,N5171B,N5183B,N5183B-303,X-SERIES,R-50C-011-5,N5183B-1E1,N5183B-AXT,R-50C-011-7,N5183A-HNZ,N5183BU-UNZ,N5183BU-UK6,N5183B-0BW,N5183BU-UNW,N5183BU-UNT,N5183A-1EM,N5183B-1EA,1CM104A,N5183A-1ER

电子商城

现货市场

授权代理品牌:集成电路


授权代理品牌:分立元件


授权代理品牌:接插件及结构件


授权代理品牌:部件、组件及配件


授权代理品牌:电源及模块


授权代理品牌:电子材料


授权代理品牌:仪器仪表及测试配组件


授权代理品牌:电工工具及材料


授权代理品牌:机械电子元件


授权代理品牌:加工与定制


登录 | 立即注册
提交评论